What the Solvency II 2019 SFCR reports say about coronavirus

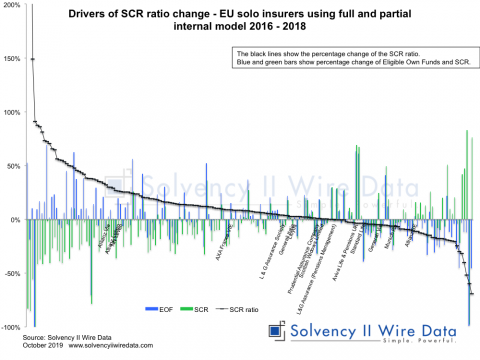
Drivers of Solvency II SCR ratio change across Europe 2016 – 2018

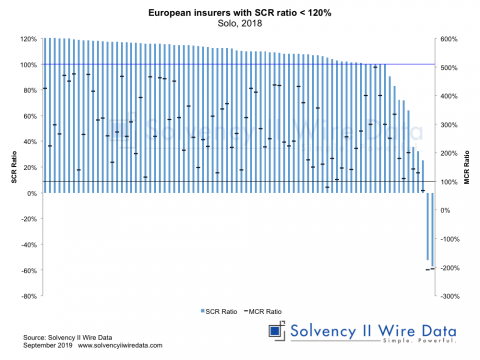
Insight into the lower end of the European insurance market

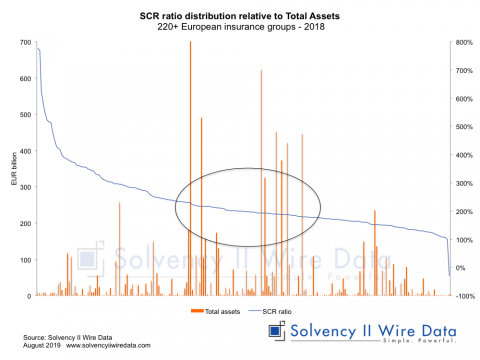
Analysis of Total Assets distribution relative to solvency ratios of European insurance groups – 2018

Solvency II News: 1st large European insurance group published 2018 SFCR

Tracking shifts in counterparty default risk

Tracking shifts in counterparty default risk

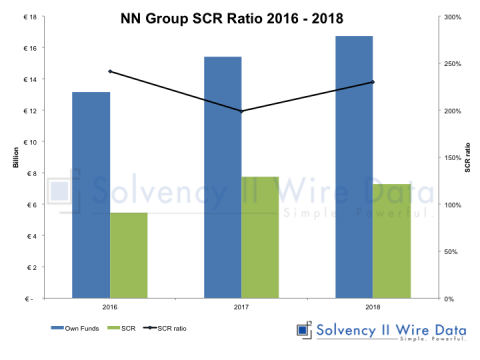
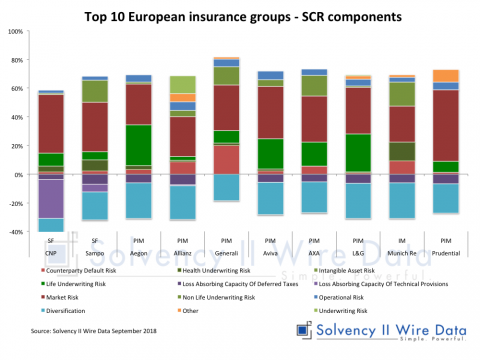
SCR components comparison of European insurance groups

Shareholder view’ biggest driver of deviation from QRT Solvency II ratio

‘Shareholder view’ biggest driver of deviation from QRT Solvency II ratio

Solvency II News: Survey shows improvement in Solvency II QRT data

Solvency II News: Survey shows improvement in Solvency II QRT data

Model change impacts on the solvency of European insurers

The average ratio for the sample (which excludes outliers above 10,000% and below 0%) was 247% in 2017 compared to 258% in 2017

Solvency II Wire News: SCR ratio analysis of over half of the European Solvency II market

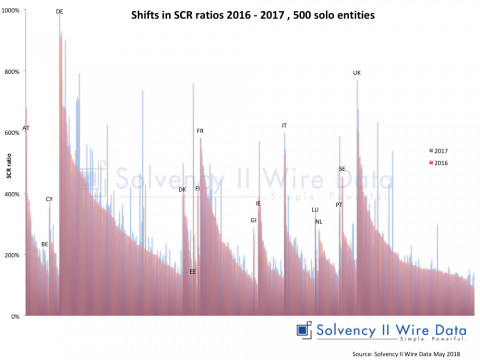
Shifts in SCR ratios 2016-2017

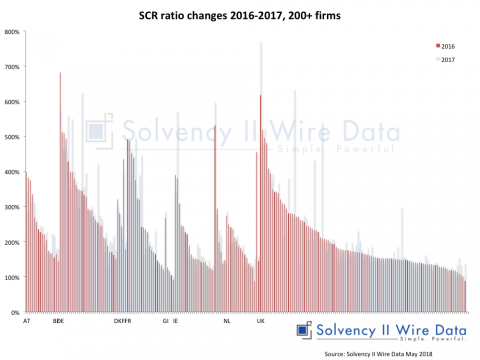
Shifts in SCR ratios 2016-2017, 200+ European insurers

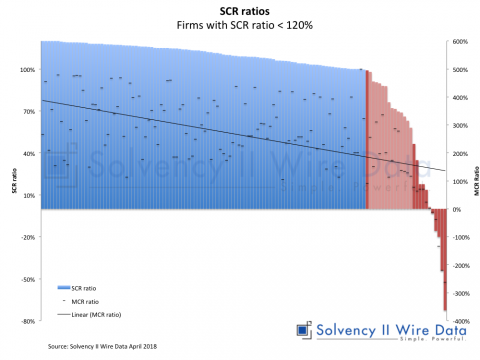
SCR components of firms with SCR ratio less than 120%

Insurance run-off and Solvency II, more firms sail close to the wind

Solvency II News: 1st 2017 SFCRs and QRTs reveal picture of Solvency II shifts

Deconstructing Internal Model SCR components

MCR shock - testing the strength of the SCR coverage ratio

MCR shock – testing the strength of the SCR coverage ratio

99 insurers sailing close to the wind

blic disclosures

Topsy-turvy SCR ratios

An emerging picture of Solvency II coverage ratios across Europe

Three-chart ‘peek’ into QRTs from Luxembourg