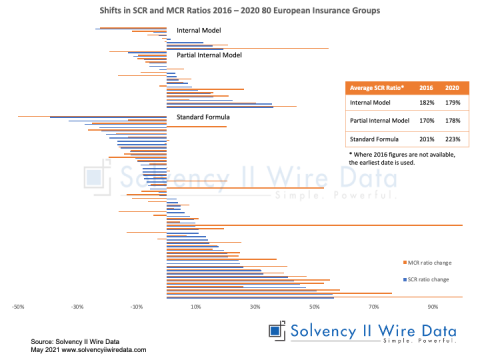
The first 100 2020 SFCRs and QRTs, fully processed and published on Solvency II Wire Data, show the shifts in the Solvency II SCR ratios between 2019 and 2020.
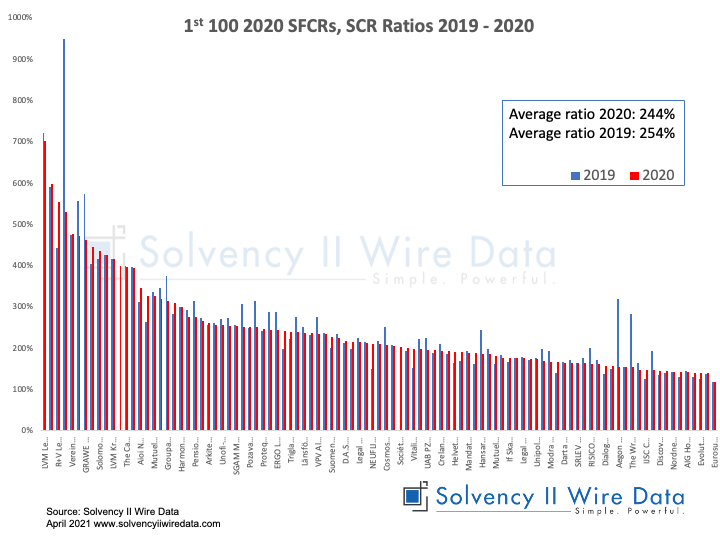
The average ratio for the sample (which includes 11 groups that published their SFCRs early) is 244%, compared to 254% for the same sample in 2019. There are, however, a few notable outliers in the 2019 data.
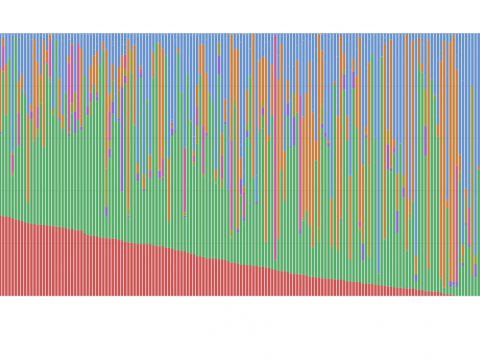
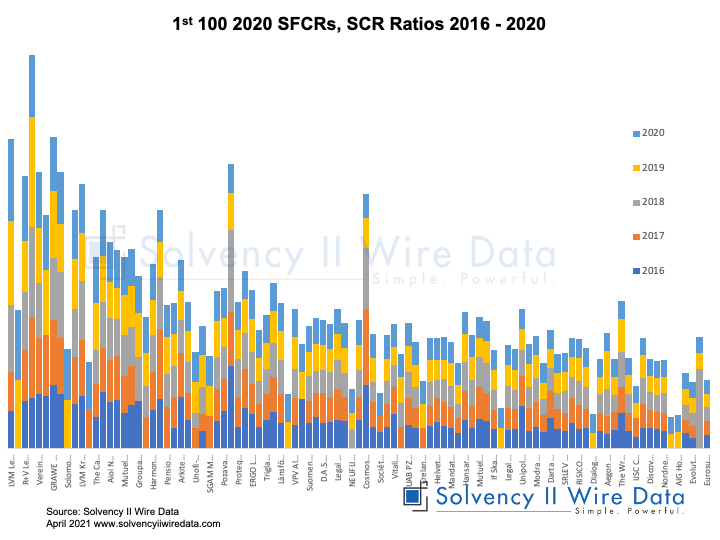
The chart below shows the SCR ratio distribution for the sample between 2016 and 2020.
Market sensitivity and SCR Components
32 firms in the sample of the 2020 SFCRs published data about market senstivity of the SCR ratio and 37 firms published further information on the breakdown of the SCR components in the SFCR.
The data has been extracted by Solvency II Wire Data and is available to view and export. The amount of additional information published varies considerably between firms. While some provide detail breakdown and impacts of a range of stresses other only provide basic information.
Solvency II Wire Data collects all available public QRT templates for group and solo.