A handful of European insurers publish their Solvency II figures ahead of the market. While the sample is too small to determine market trends it may reveal some insights into the pattern of capital strength of individual companies.
In January 2017 Solvency II Wire Data published the first analysis of the Solvency and Financial Condition Reports of a similar sample of companies; How do you SFCR? has served as a template for analysis of the narrative Solvency II disclosures since. Now as companies prepare for their fourth year of reporting, it is possible to begin to detect emerging patterns in their Quantitative Reporting Templates (QRTs).
The chart below shows the percentage change in the Solvency II SCR ratio of 6 solo entities and 1 group.
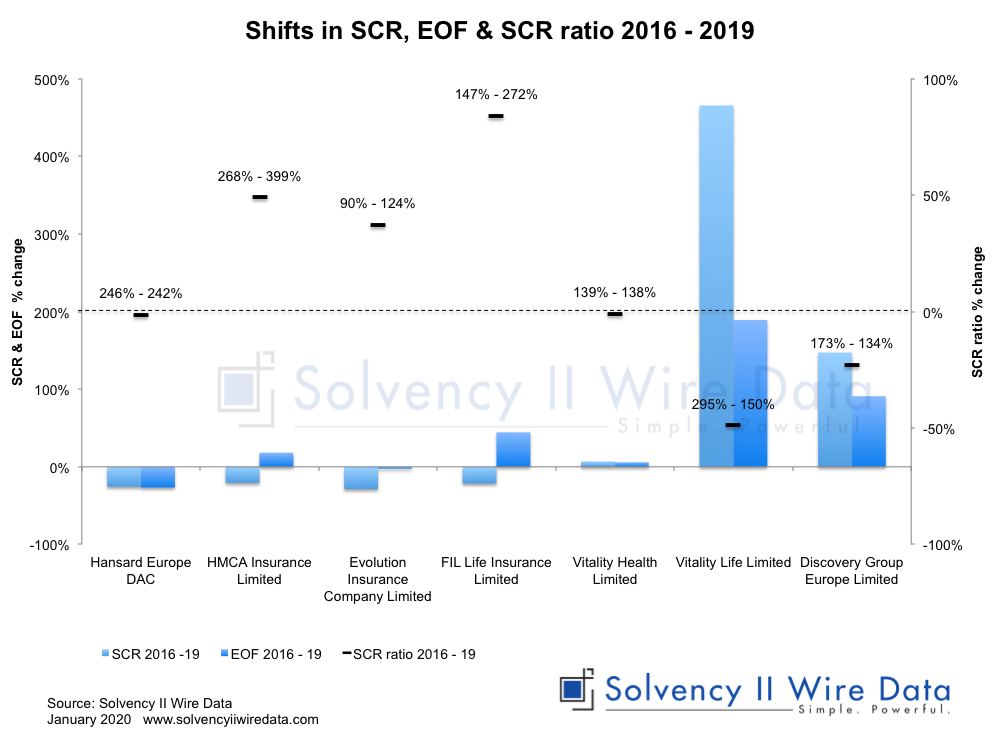
The right axis (horizontal lines) shows the percentage change of the ratio between 2016 and 2019 (the respective values are shown for each company).
The left axis (bars) shows the corresponding percentage change for the components of the ratio: the Solvency Capital Requirement (SCR) and the Total Available Own Funds to meet the SCR (EOF).
For some companies the change in the ratio is driven by a decrease in the SCR. For example, Evolution Insurance Company saw its SCR ratio rise by 37% (from 90% in 2016 to 124% in 2019) largely due to a 29% drop in its SCR over the period, while the amount of EOF remained mostly unchanged.
In contrast Fil Life Insurance, experienced an 84% increase in the SCR ratio over the same period, largely due to a 44% increase in EOF and a 21% decrease in the SCR.
Similarly, the 49% drop in the SCR ratio of Vitality Life Limited (295% to 150% in 2019) is due to a substantial increase in the SCR, which far outweighing the increase in EOF.
Three groups also reported early figures, two of the groups are new in 2019. Discovery Group Europe is the only group to have consistently published its Solvency II disclosures ahead of the market, which are due in April 2020.
Emerging trends in capital strength
Analysis of the year on year change in the SCR ratio for each insurer reveals that in most cases there is a trend in a single direction (either up or down). Only one company, Hansard Europe DAC showed any significant change in trend over time (see chart below).

In 2016 it had a ratio of 246%, which rose to 249% in 2017 then dropped to 242% in 2018 and rose slightly in 2019 to 243%.
Figures from across the EEA appear to support this hypothesis to some degree.
The table below shows SCR ratios between 2016 and 2018 by country published by EIOPA.
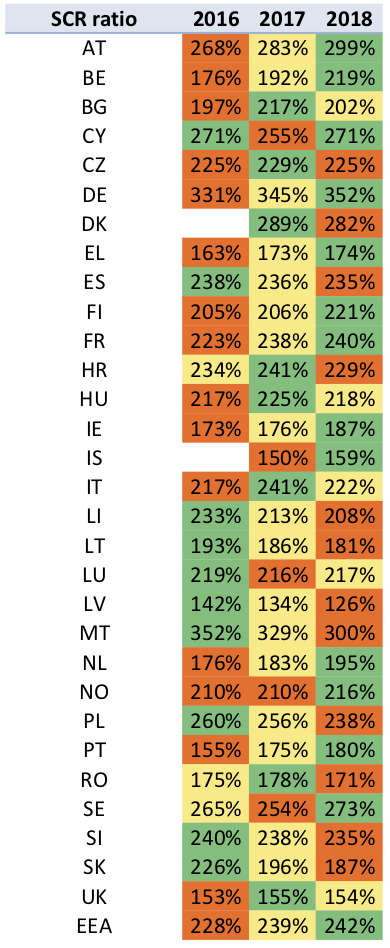
For each country, the highest value of the three years is green and the lowest is red. Yellow represents the middle value. Of the 28 EEA countries that published figures for all three years, 17 exhibit the linear trend pattern. Figures for the entire EEA also support this trend.
It remains to be seen whether the 2019 figures will support this trend.
The Full set of QRTs for all data in charts is available to Solvency II Wire Data subscribers. Click here to find out more.
Solvency II Wire Data collects all available public QRT templates for group and solo.
QRT templates available on Solvency II Wire Data
S.02.01 Balance sheet
S.05.01 Premiums, claims and expenses Life & Non-life
S.05.02 Premiums, claims and expenses by country Life & Non-Life
S.12.01 Life and Health SLT Technical Provisions
S.17.01 Non-life Technical Provisions
S.19.01 Non-life Insurance Claims Information
S.22.01 Impact of long term guarantees and transitional measures
S.23.01 Own funds
S.25.01 SCR Standard formula
S.25.02 SCR Standard Formula Partial Intern Models
S.25.03 SCR Standard Formula Intern Model
S.32.01 Undertakings in the scope of the group