ANALYSIS

Under Solvency II, the SCR coverage ratio has become the de-facto measure of an insurer’s capital strength. But how reliable an indicator is it? Cat Drummond, Partner at LCP, explores the capital resilience of the top 100 non-life insurers in the UK and Ireland by testing their SCR coverage ratio against an MCR shock.
Introduction
The SCR coverage ratio is considered to be the new measure of an insurer’s capital strength under Solvency II. Like all headline metrics it serves a useful purpose, but does not tell the whole story.
Understanding the underlying assumptions and drivers of the ratio can help to assess both the strength of an insurer’s capital and the reliability of the measure as a whole.
Capital cover
Regulators expect firms to have at least as much capital as their Solvency Capital Requirement (SCR). The SCR represents the maximum loss over the next year at a confidence level of 99.5% (or 1-in-200 years). This means that for a firm with an SCR of £100m, there is a 99.5% chance that the loss over the next year will not be more than the SCR.
The SCR coverage ratio is the ratio of capital that insurers have available to support their SCR (the “eligible own funds”) to the SCR. It provides a measure of the buffers a firm has in place to withstand balance sheet volatility while still holding enough capital to comply with the regulatory requirement. The following graph shows the 20 least well-capitalised firms out of 100 of the top non-life insurers across the UK and Ireland[1].
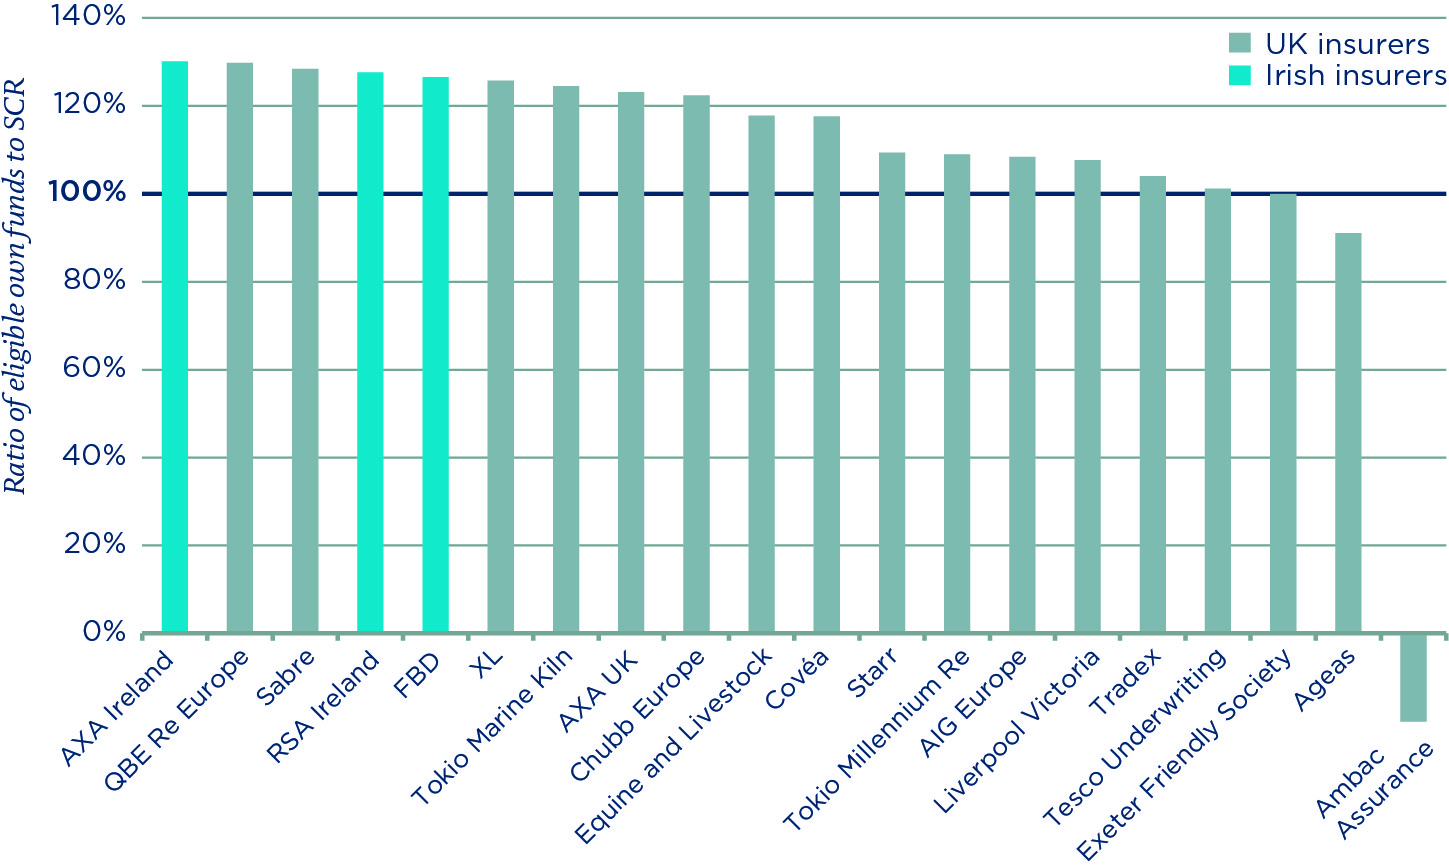
Two firms, Ageas, and Ambac Assurance, breached their SCR coverage ratio and did not have sufficient capital in place to cover their SCRs as at the balance sheet date. The rest had sufficient capital to meet the regulatory requirement, but in some cases, the buffers were very small (see for example Tradex and Tesco Underwriting). All else being equal, the more capital a firm has, the less likely it is that it will need to recapitalise in future.
To test the likelihood of the need to recapitalise other metrics need to be considered in order to assess the strength of the SCR coverage ratio.
The Minimum Capital Requirement (MCR) may prove an effective way of assessing what a “reasonably foreseeable” loss might be, by applying an MCR shock to the SCR coverage ratio.
Impact of an MCR loss
The MCR is calculated using a simple formula linked to the amount and type of business written. It is intended to represent the maximum loss over the next year at a confidence of 85% (or 1-in-6.67 years).
The formula for calculating the MCR differs from the SCR calculation in a number of ways:
- it is much less complex than the SCR calculation;
- it makes no allowance for any diversification; and
- it is retrospective (based on prior year measures), whereas the SCR is prospective.
The MCR is also constrained to be within a range of 25% to 45% of the SCR (subject to an absolute minimum for very small firms). These additional constraints help to ensure the final MCR remains appropriate and enables a proper “ladder of supervisory intervention” when a firm breaches requirements and must engage with its regulator to restore its cover.
Given its calibration, the MCR could be used as a proxy for a “reasonably foreseeable” loss and consider what impact this might have on capital coverage.
The following chart shows the impact on the SCR coverage ratio if a firm experienced an instantaneous loss equal to its MCR (lighter shaded bars show ratio before loss).
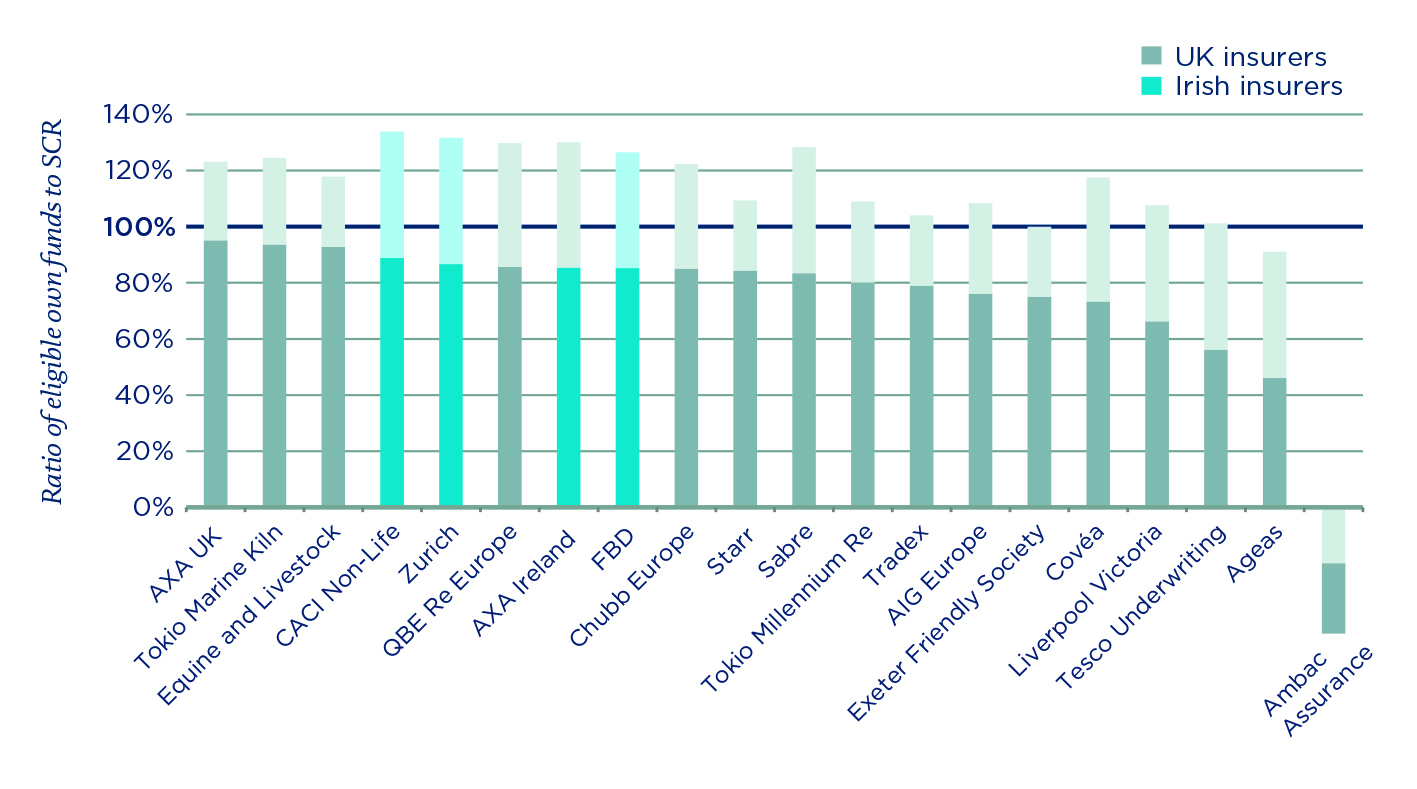
After mechanically applying the MCR shock 23% of the top 100 firms analysed would need to recapitalise following a “reasonably foreseeable” loss. Unsurprisingly, many of the firms with low SCR ratios listed above feature in this segment. However, the ordering of the companies has changed, driven by the relative size of the MCR to the SCR, which may be different for each insurer.
For example, the MCRs for CACI Non-Life and Sabre are 45% of their SCRs (i.e. the maximum allowed percentage). As a result the SCR ratio for both firms weakens considerably after an MCR loss. Conversely, as the MCRs for both Equine and Livestock and Tradex are 25% of their SCRs (i.e. the minimum allowed percentage), they are not as severely affected.
Lower MCR/SCR ratios can be driven by a number of factors including:
- material exposures to catastrophe risks or non-insurance risks (which increase the SCR but are not considered in the MCR calculation); and/or
- writing fewer lines of business – which results in less diversification benefit (diversification reduces the SCR but is not allowed for in the MCR).
It is also worth noting that in reality the capital cover for those companies with ring-fenced funds restrictions (e.g. Exeter Friendly Society) may have sufficient additional funds available to support the SCR should these losses occur in practice.
Making sense of the SCR coverage ratio

The market continues to explore the Solvency II metrics and in particular the SCR coverage ratio as the key headline figure of an insurer’s capital strength. Gaining a better understanding of the robustness of this metric is crucial to make sense of Solvency II and the usefulness of the Solvency II public disclosures.
—
The author is a Partner at LCP’s Insurance Consulting practice. Views expressed are the author’s own.
The article is based on analysis conducted by LCP. The report, Solvency ll reporting 2017, can be accessed here.
Notes:
[1] Note that Exeter Friendly Society’s Eligible Own Funds are limited to the value of their SCR due to the Solvency II rules for ring-fenced funds.
** The name of the specific entity used for each group is listed in the report.
—
Find out more about Solvency II Wire Data and the information available to premium subscribers here: Solvency II Wire Data.