Analysis of the 2019 Solvency II SFCRs and QRTs of 300 solo insurers, with EUR 4.9 trillion assets under management shows a reduction in the SCR ratio relative to last year.
The sample, which accounts for about 40% of total assets managed by the European insurance industry (based on EIOPA 2018 figures), has an average SCR ratio of 273%. In 2018 the average SCR ratio for the sample was 282%.
The average MCR ratio decreased from 748% to 732% in 2018.
The charts below shows the distribution of ratios by country.

Solvency II Wire Data estimates that to date about 600 European insurers have published their Solvency II figures for 2019. It is expected that the remainder of the solo entities will publish, at least initial figures, by 21 April in accordance with guidelines issued by EIOPA.
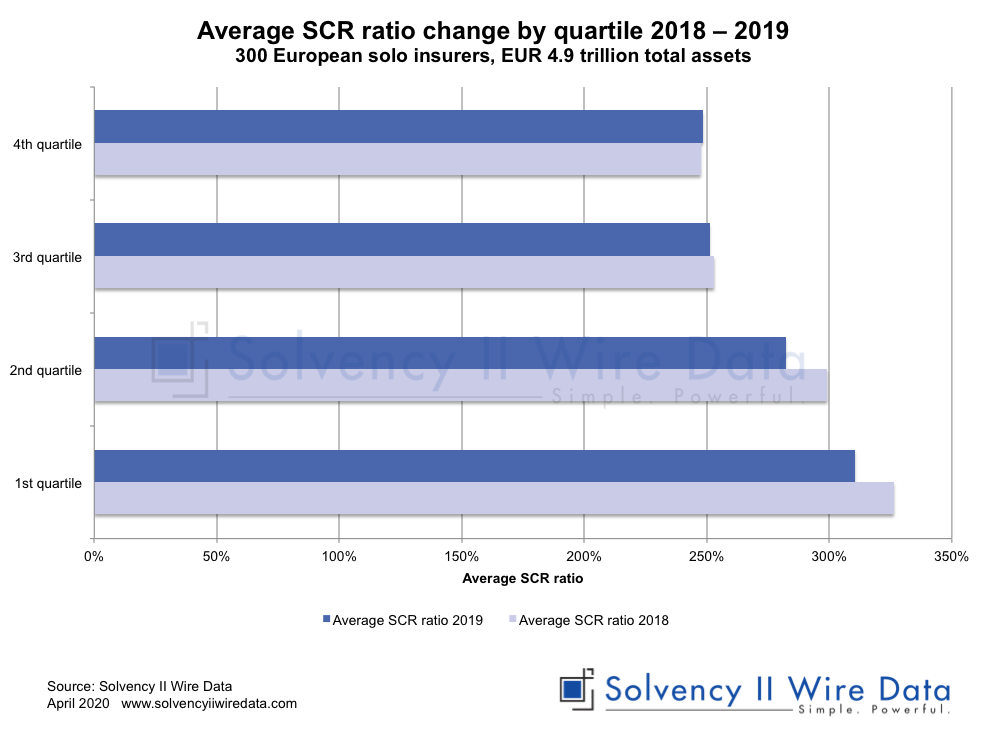
Analysis of the change in SCR ratios by quartile (see chart) reveals that the majority of the reduction in the SCR ratios can be found in the first and second quartiles (16% and 17% respectively). In contrast the lower quartiles show little change relative to 2018 (2% and 1% respectively).
Solvency II Wire Data collects all available public QRT templates for group and solo.
QRT templates available on Solvency II Wire Data
S.02.01 Balance sheet
S.05.01 Premiums, claims and expenses Life & Non-life
S.05.02 Premiums, claims and expenses by country Life & Non-Life
S.12.01 Life and Health SLT Technical Provisions
S.17.01 Non-life Technical Provisions
S.19.01 Non-life Insurance Claims Information
S.22.01 Impact of long term guarantees and transitional measures
S.23.01 Own funds
S.25.01 SCR Standard formula
S.25.02 SCR Standard Formula Partial Intern Models
S.25.03 SCR Standard Formula Intern Model
S.32.01 Undertakings in the scope of the group