Research conducted by Solvency II Wire Data shows that the vast majority of European insurers are taking advantage of the delays to the publication of the Solvency II public disclosures recommended by EIOPA.
As of 19 April 2020 Solvency II Wire Data estimates that about 700 European insurers, out of c. 3,350 firms subject to the Solvency II public disclosure rules, have published their SFCRs and QRTs.
Most of the firms, including 27 groups, published the full set of QRTs and complete SFCR. Only 18 of these have taken advantage of the relaxation of the reporting rules that only require some templates to be published by 21 April 2020. The full set of disclosures must now be published by June (see Solvency II Wire 8/4/2020)
Solvency II ratios 2019
Analysis of the data shows that SCR ratios in 2019 are lower than last year, however the differences vary depending on the size of the company (see also Solvency II Wire 14/4/2020).
A sample of 530 solo insurers with EUR 6.5 trillion assets under management, for which the full set of QRTs has been extracted, has an average SCR ratio of 270%. Last year the same sample had an average SCR ratio of 278%.
The ratios range between 104% ( VPV Lebensversicherungs-AG) and 947% (VPV Lebensversicherungs-AG). Outliers above 1,000% and below 0% have been excluded.
The chart below shows the distribution of SCR ratios by country.
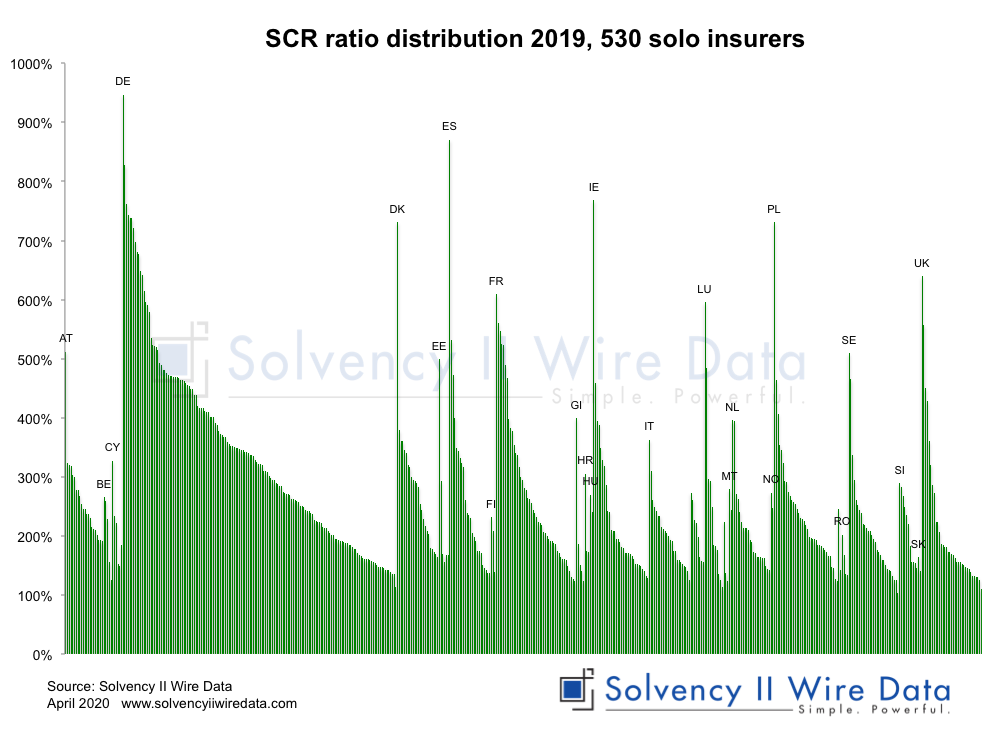
However, in line with earlier findings (Solvency II News: SCR ratios lower in 2019) the change in SCR ratios varies depending on the size of the companies with the bulk of the reduction occurs in the upper two quartiles of the sample.
Eligible Own Funds to Meet the SCR 2019
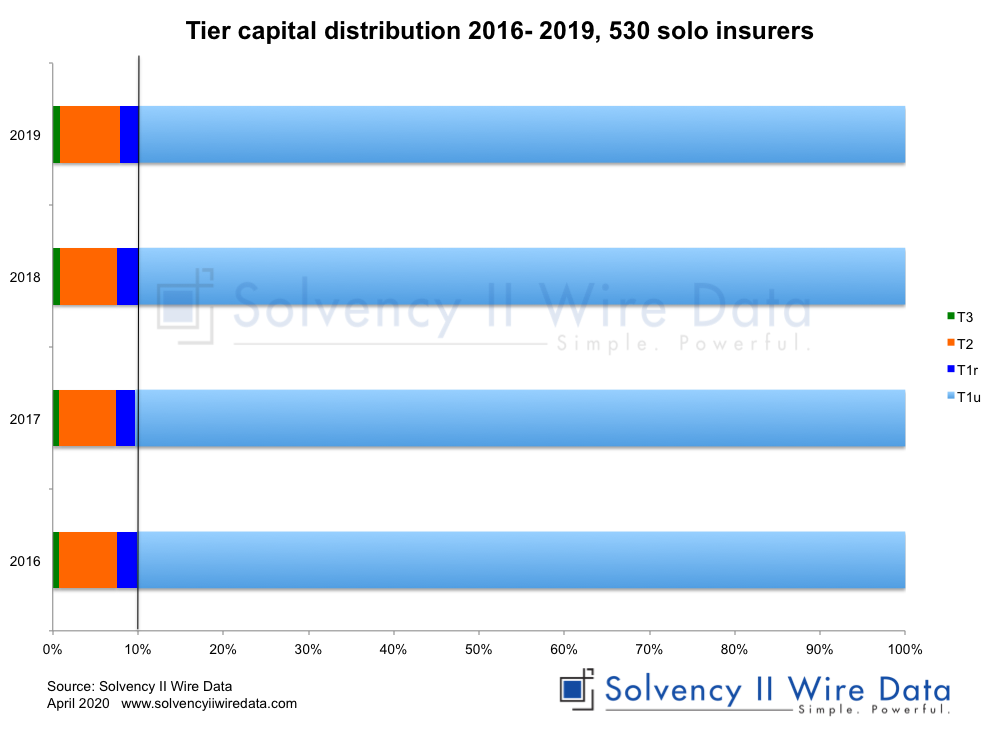
The capital distribution of the sample remains in line with overall figures with Tier1 unrestricted capital forming the bulk of the Eligible Own Funds (EOF) to meet the SCR.
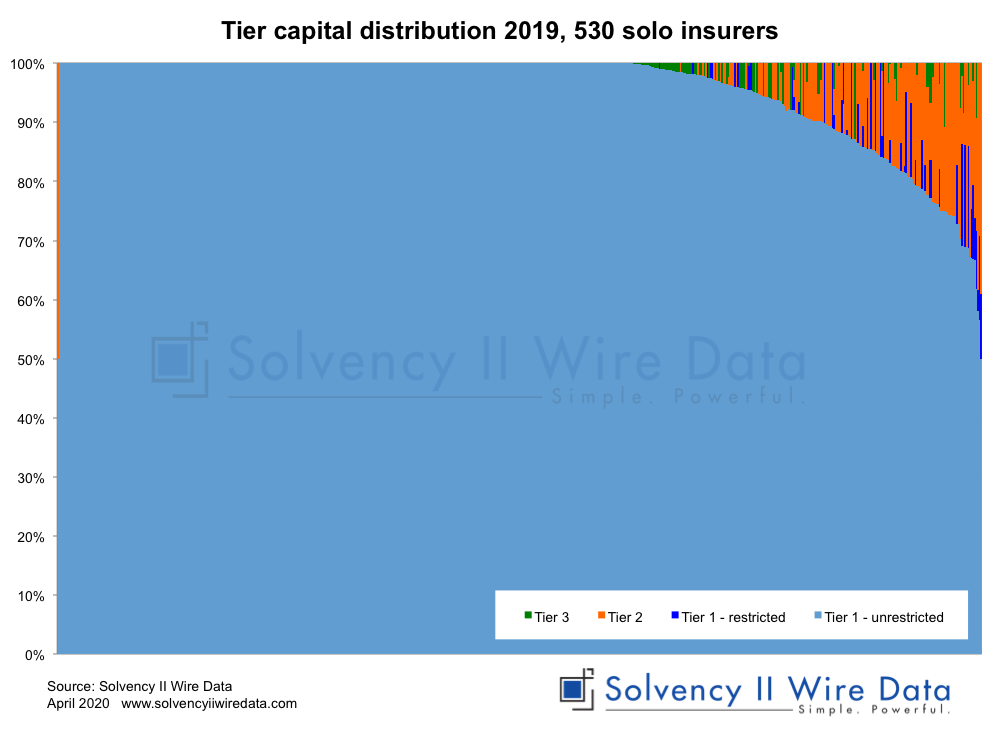
However, the trend for the sample, which reported EUR 760.9 billion EOF shows that over the past four years there has been a slight shift away from the use of tier 1 capital. Although it still accounts for about 90% of EOF.
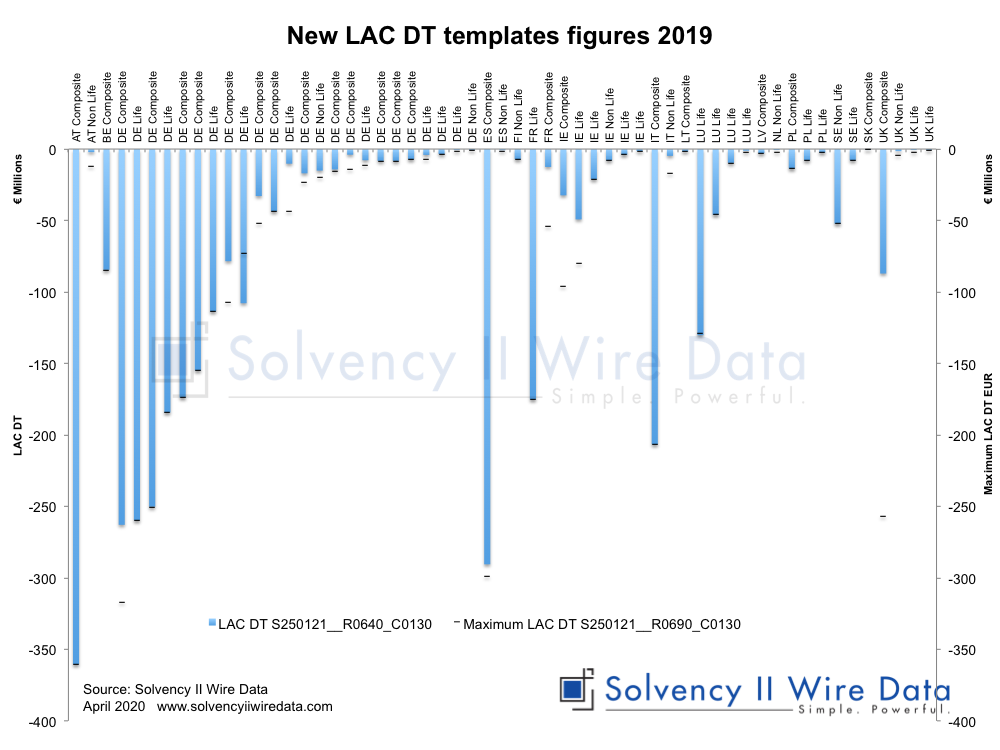
New LAC DT figures
To date close to 60 solo entities have published additional LAC DT information in the modified S.25 templates (see also Insurers slow to publish 2019 Solvency II figures).
The chart below shows distribution of reported figures by country.
The state of Solvency II public disclosures
It is still expected that the vast majority of insurers will publish initial figures by 21 April, yet the extent and pace at which the full set of figures will be disclosed by June remains unclear.
Solvency II Wire Data collects all available public QRT templates for group and solo.
QRT templates available on Solvency II Wire Data
S.02.01 Balance sheet
S.05.01 Premiums, claims and expenses Life & Non-life
S.05.02 Premiums, claims and expenses by country Life & Non-Life
S.12.01 Life and Health SLT Technical Provisions
S.17.01 Non-life Technical Provisions
S.19.01 Non-life Insurance Claims Information
S.22.01 Impact of long term guarantees and transitional measures
S.23.01 Own funds
S.25.01 SCR Standard formula
S.25.02 SCR Standard Formula Partial Intern Models
S.25.03 SCR Standard Formula Intern Model
S.32.01 Undertakings in the scope of the group