Solvency II Group SFCR reports are published today (19 May 2020). Several groups have already published their data at the earlier publication data of the solo SFCRs.
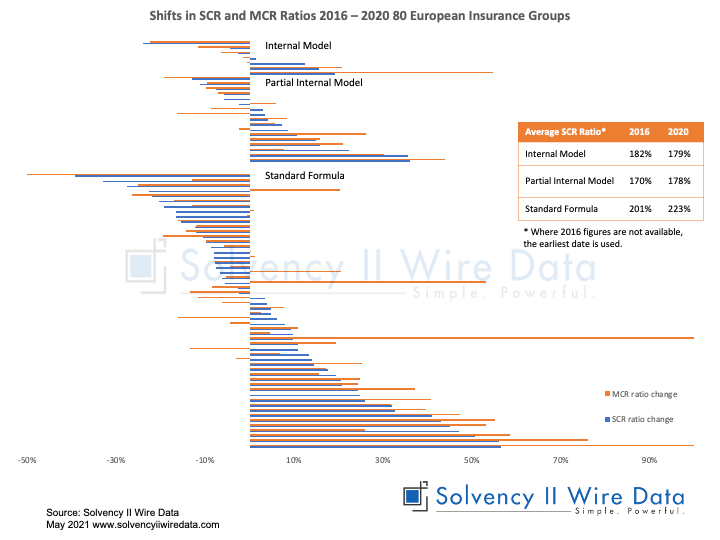
The chart shows the shifts in SCR ratio and MCR ratios between 2016 and 2020 for 80 European Groups that published their Group SFCR early.
The full dataset is available on Solveny II Wire Data.
See additional group SFCR data Shift in SCR ratios 59 European Insurance Groups 2016 – 2019 and learn about group structure.